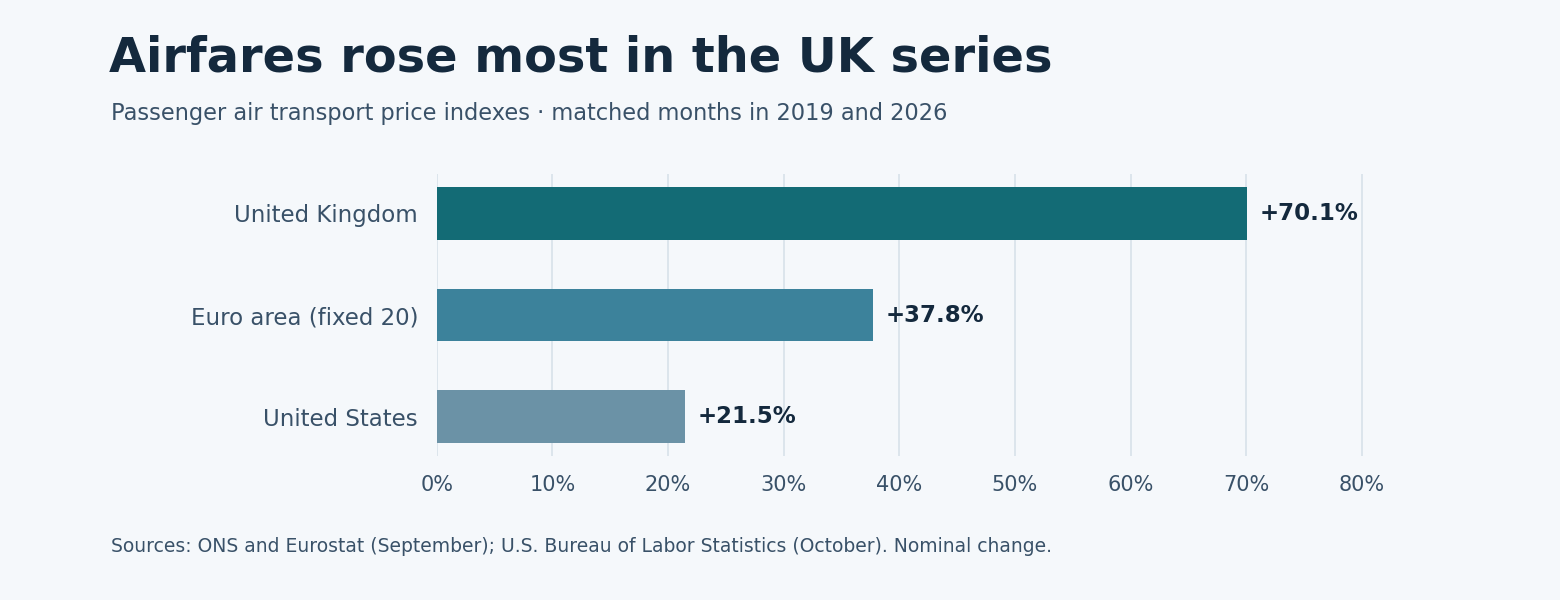
The UK airfare price index rose 70.1% from September 2019 to September 2026, the largest increase among the travel price series tracked here. The euro area airfare index rose less, and U.S. lodging rose more slowly than U.S. consumer prices overall. The study uses official consumer price indexes to compare flights, lodging, eating out and package holidays without treating them as a single global travel basket.
Key findings
- The UK passenger air transport index rose 70.1% from September 2019 to September 2026 (ONS · D7EH).
- Euro area passenger air transport prices rose 37.8% from September 2019 to September 2026 (Eurostat · CP0733MI15EA20M086NEST).
- Euro area accommodation services prices rose 42.1% from September 2019 to September 2026 (Eurostat · CP112MI15EA20M086NEST).
- U.S. food away from home prices rose 39.8% from October 2019 to October 2026 (BLS · CUUR0000SEFV).
- The UK package holiday index rose 42.6% from September 2019 to September 2026 (ONS · D7FN).
- Portugal’s combined restaurants and hotels index rose 45.6% from September 2019 to September 2026 (Eurostat · CP1100PTM086NEST).
- UN Tourism recorded an estimated 690 million international tourist arrivals worldwide in the first half of 2026 (September 2026 World Tourism Barometer).
Methodology
The study uses published, non-seasonally adjusted price indexes from the U.S. Bureau of Labor Statistics (BLS), the UK Office for National Statistics (ONS) and Eurostat’s monthly HICP dataset. The U.S. endpoint is October 2026, released November 10. The UK and Eurostat endpoints are September 2026, released October 21 and October 16, respectively. Each endpoint is compared with the same calendar month in 2019 to limit seasonal distortion. The tables link to the individual official series, including agency data distributed by the Federal Reserve Bank of St. Louis through FRED.
Cumulative nominal change = (latest index ÷ matched 2019 index − 1) × 100. For example, the ONS · D7EH index moved from 101.7 in September 2019 to 173.0 in September 2026: (173.0 ÷ 101.7 − 1) × 100 = 70.1%, rounded to one decimal. The calculation uses the available published precision. It does not adjust for exchange rates or general inflation.
These are consumer basket indexes, not average ticket or room prices. The agencies use different baskets, weights, and collection methods; U.S. comparisons also end a month later. The euro area aggregate uses the fixed 20-country series except for restaurants and cafés, where the published series uses changing membership. The country table compares a common combined category. It cannot show the cost of a stay in a particular city or rank destinations by affordability.
Flights: the largest increase was in the UK series
The UK, euro area and U.S. airfare indexes all rose from their matched pre-pandemic months, but by very different amounts. These indexes track prices for their respective consumer markets; they are not an estimate of the markup on a particular route.
| Market | Official series | 2019 index | Latest index | Change | Source |
|---|---|---|---|---|---|
| United Kingdom | Passenger transport by air | 101.7 (Sep) | 173.0 (Sep 2026) | +70.1% | ONS · D7EH |
| Euro area (fixed 20) | Passenger transport by air | 71.86 (Sep) | 99.00 (Sep 2026) | +37.8% | Eurostat · CP0733MI15EA20M086NEST |
| United States | Airline fares | 269.871 (Oct) | 327.822 (Oct 2026) | +21.5% | BLS · CUUR0000SETG01 |
Hotels and other lodging
Lodging prices rose more in the euro area and UK series than in the U.S. series. U.S. lodging increased 17.6%, below the 31.2% rise in the U.S. all-items index over the same October-to-October period (BLS · CUUR0000SEHB; BLS · CPIAUCNS). Lodging indexes cover more than a particular hotel class and should not be read as average nightly room rates.
| Market | Official series | 2019 index | Latest index | Change | Source |
|---|---|---|---|---|---|
| Euro area (fixed 20) | Accommodation services | 78.72 (Sep) | 111.88 (Sep 2026) | +42.1% | Eurostat · CP112MI15EA20M086NEST |
| United Kingdom | Accommodation services | 117.5 (Sep) | 163.0 (Sep 2026) | +38.7% | ONS · D7CX |
| United States | Lodging away from home | 160.340 (Oct) | 188.581 (Oct 2026) | +17.6% | BLS · CUUR0000SEHB |
Restaurants and food away from home
Eating out rose faster than the broad consumer price index in both the U.S. and UK over their respective windows. The U.S. food-away-from-home measure is broader than the UK restaurant and café measure. For a trip budget, use these changes to identify which assumptions to recheck, then price meals locally.
| Market | Official series | 2019 index | Latest index | Change | Source |
|---|---|---|---|---|---|
| United States | Food away from home | 286.791 (Oct) | 400.850 (Oct 2026) | +39.8% | BLS · CUUR0000SEFV |
| United Kingdom | Restaurants and cafés | 111.8 (Sep) | 157.9 (Sep 2026) | +41.2% | ONS · D7EW |
| Euro area (changing composition) | Restaurants, cafés and the like | 78.19 (Sep) | 104.39 (Sep 2026) | +33.5% | Eurostat · CP1111EZCCM086NEST |
| United States | All items | 257.346 (Oct) | 337.511 (Oct 2026) | +31.2% | BLS · CPIAUCNS |
| United Kingdom | All items | 108.5 (Sep) | 144.1 (Sep 2026) | +32.8% | ONS · D7BT |
Package holidays
The UK package holiday index is measured separately from accommodation services. It was 42.6% above its September 2019 level in September 2026 (ONS · D7FN). The table reports only the UK stand-alone series: no combined lodging-and-packages measure is used as a substitute for package prices.
| Market | Official series | 2019 index | Latest index | Change | Source |
|---|---|---|---|---|---|
| United Kingdom | Package holiday | 112.3 (Sep) | 160.1 (Sep 2026) | +42.6% | ONS · D7FN |
Country and region comparison: restaurants and hotels
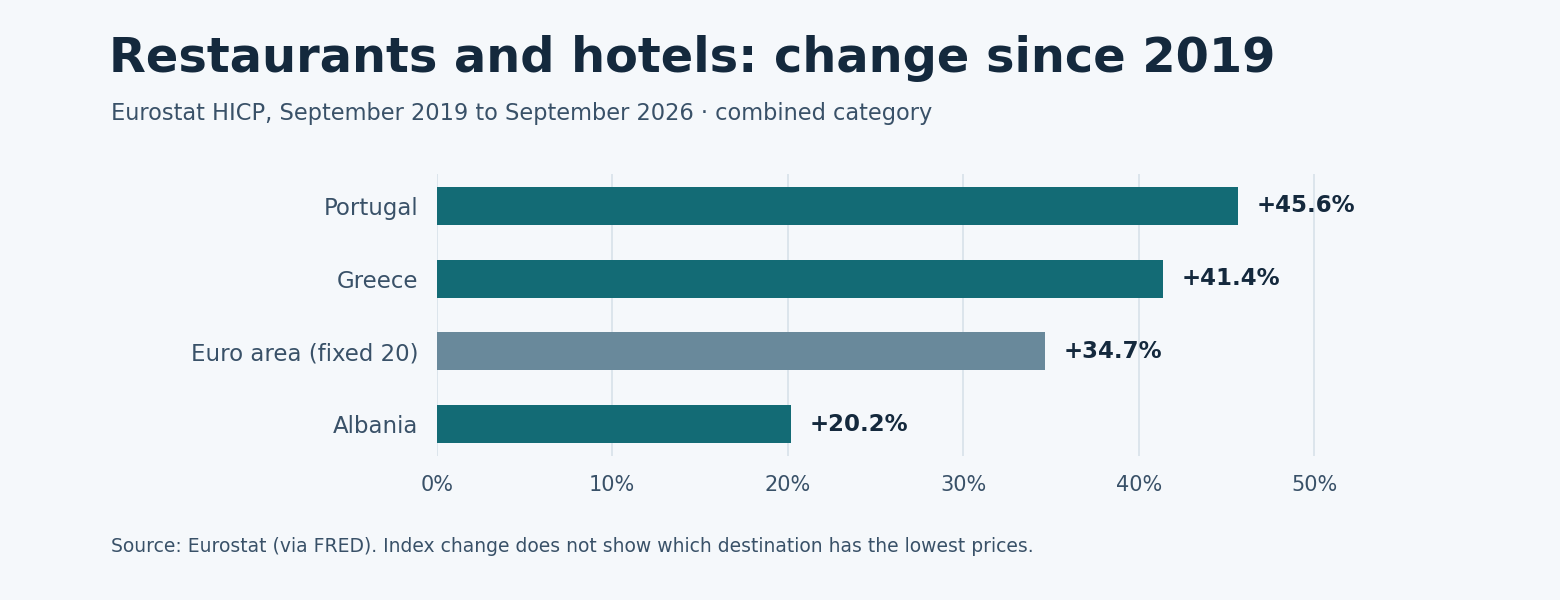
On the same Eurostat category and matched September dates, the index rose faster in Portugal and Greece than in the fixed euro area aggregate, and more slowly in Albania. The chart shows how quickly prices changed, not which country has the cheapest room or meal. For today’s travel budgets, see the separate guides to Portugal trip costs, Greece trip costs and the cost of a trip to Europe.
| Market | Official series | 2019 index | Latest index | Change | Source |
|---|---|---|---|---|---|
| Portugal | Restaurants and hotels | 76.50 (Sep) | 111.42 (Sep 2026) | +45.6% | Eurostat · CP1100PTM086NEST |
| Greece | Restaurants and hotels | 80.12 (Sep) | 113.26 (Sep 2026) | +41.4% | Eurostat · CP1100GRM086NEST |
| Euro area (fixed 20) | Restaurants and hotels | 78.65 (Sep) | 105.91 (Sep 2026) | +34.7% | Eurostat · CP11MI15EA20M086NEST |
| Albania | Restaurants and hotels | 86.00 (Sep) | 103.37 (Sep 2026) | +20.2% | Eurostat · CP11MI15ALM086NEST |
Tourism demand: arrivals are not prices
UN Tourism’s September 2026 World Tourism Barometer, Table 1 puts full-year international arrivals at 1,544 million in 2025, up 4.4% from 1,479 million in 2019 on the rounded published totals. The 2025 total is provisional. Its first-half 2026 estimate was 690 million arrivals, up 0.4% year over year; that partial-year observation is kept separate from the full-year totals. These counts describe the recovery in tourism volume and do not identify its effect on prices.
| Period | International arrivals | Source or status |
|---|---|---|
| 2019 | 1,479 million | UN Tourism, Table 1 |
| 2020 | 413 million | UN Tourism, Table 1 |
| 2021 | 468 million | UN Tourism, Table 1 |
| 2022 | 991 million | UN Tourism, Table 1 |
| 2023 | 1,339 million | UN Tourism, Table 1 |
| 2024 | 1,474 million | UN Tourism, Table 1 |
| 2025 | 1,544 million | Provisional · UN Tourism, Table 1 |
| First half of 2026 | 690 million | Estimate · not a full-year total |
Download the study data (CSV) — source series, observation dates, raw index values, calculations and tourism-volume context.
What this means for travelers in 2026
Reprice flights and rooms separately. Check the same dates with bags, local taxes, transfers and cancellation terms included. For an itinerary budget outside the European comparison, use the separate Southeast Asia cost guide, Thailand cost guide or Mexico cost guide; those are planning guides, not inputs to this study.
Why is travel so expensive in 2026?
Some costs rose much faster than others. The UK airfare index was 70.1% above September 2019 (ONS · D7EH), and U.S. food away from home was 39.8% above October 2019 (BLS · CUUR0000SEFV). These indexes show which costs rose; they do not measure how much of the change came from demand, fuel or labor.
Have hotel prices gone up since 2019?
Yes in the lodging indexes tracked here, but the size of the increase depends on the market. Euro area accommodation services rose 42.1% from September 2019 to September 2026 (Eurostat · CP112MI15EA20M086NEST); U.S. lodging away from home rose 17.6% from October 2019 to October 2026 (BLS · CUUR0000SEHB). Neither index tells you how an individual property’s rates or service changed.
Did travel prices rise faster than inflation?
It depends on what you buy. From October 2019 to October 2026, U.S. food away from home rose 39.8%, compared with 31.2% for all items (BLS · CUUR0000SEFV; BLS · CPIAUCNS). U.S. lodging rose only 17.6% over the same window (BLS · CUUR0000SEHB).
Are hostels still cheaper than hotels for solo travelers?
The UK accommodation index rose 38.7% from September 2019 to September 2026 (ONS · D7CX), but that broad measure cannot tell you whether a dorm bed or a private room is cheaper today. Compare the total per person for the same dates, neighborhood and cancellation terms; if you’re comparing a private hostel room with a budget hotel, check what each includes.
Can a lower-inflation destination make a trip cheaper?
Not by itself. Albania’s restaurant and hotel index rose 20.2%, compared with Portugal’s 45.6%, from September 2019 to September 2026 (Eurostat · CP11MI15ALM086NEST; Eurostat · CP1100PTM086NEST). That compares the pace of change; to compare actual trips, price a similar room, meals and transport in both places for the same dates.
How should you budget for unexpected travel costs?
Build a separate contingency from the price of a replacement room, transfer and ticket on your actual route. The UK package holiday index rose 42.6% between September 2019 and September 2026 (ONS · D7FN), but that figure is not a rule for how much cash to set aside. Check which costs your booking terms or insurance would cover before setting the buffer.
FAQ
Does the study measure global travel inflation?
No. It compares selected official consumer price series and reports global arrivals separately as context. There is no single world price change in the study.
Why compare the same month of the year?
Fares and accommodation prices fluctuate seasonally. Matching calendar months reduces the risk of mistaking a seasonal difference for long-term inflation.
Are the price changes adjusted for exchange rates?
No. They are nominal changes in each official price index. A traveler paying from a different currency can see a different change in the amount charged to their card.
Why do the September and October releases differ?
National agencies publish on different schedules. The comparison uses each detailed series’ latest available release on the check date and matches it with the same month in the baseline year.
Where can the original observations be checked?
Follow the source link in the relevant table row. The downloadable CSV includes both observations, series identifiers, source links and the calculated change.
Cite this study
Suggested citation: Travel Cool Places, Tourism Inflation Study 2019–2026, November 2026, https://travelcoolplaces.com/travel-inflation-study/.
The study’s data tables and original charts may be reused with attribution and a link to the study (CC BY 4.0 for the original charts). Please credit the statistical agencies as the sources of the underlying figures and follow their reuse terms.
Data checked on November 10, 2026.